PeakMetrics / Fact Checks
Economy & business fact checks
Explore claims publishers have checked about economy & business. Read their original ratings and follow the evidence.
Search fact checks
Search by text or image7,104 published reviews in this topic
West Australian Premier Mark McGowan claims virtually all WA rock lobster is exported to China, which has led to local lobster prices of around $100/kg.
Publisher’s rating: Mostly True – Mostly accurate, but there is a minor error or problem.
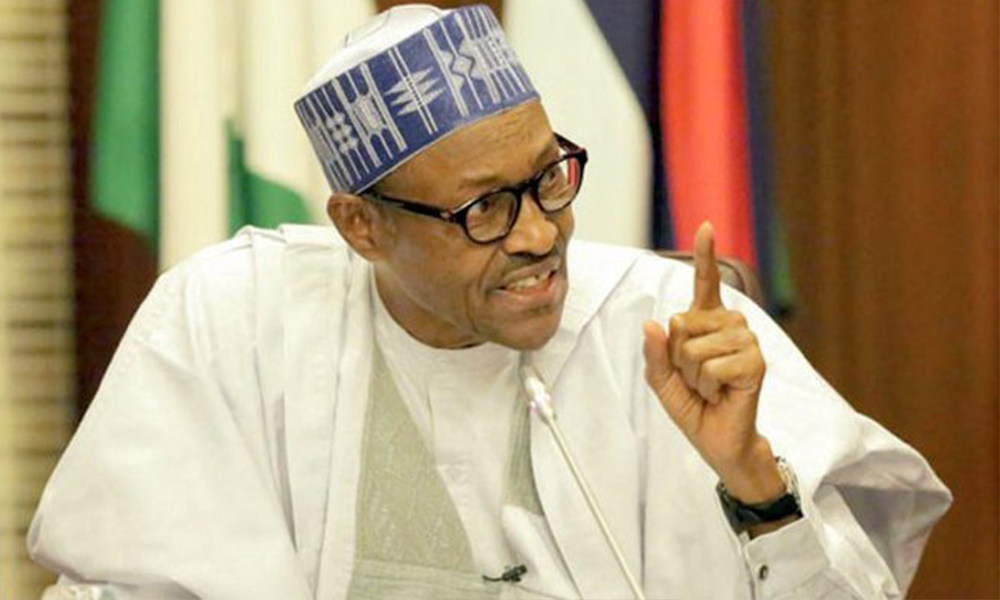
A claim that in Agriculture, we are seeing increased investment across the entire value chain from agricultural inputs to farming and ultimately, food processing. Barely three years ago, Nigeria was spending $5 million dollars a day, on rice importation.
Publisher’s rating: This claim is unproven
A claim that of the total appropriation of N9.12 trillion 2018 budget, N4.59 trillion had been spent by September 30, 2018 against the prorated expenditure target of N6.84 trillion. This represents 67 per cent performance.
Publisher’s rating: Until more information emerges on this, the president’s claim remains unproven.

Collateral free loans for 12 crore small entrepreneurs under MUDRA.
Publisher’s rating: TRUE
Of the total loan accounts, 76% are of women and more than 50% belong to SCs, STs and OBCs.
Publisher’s rating: TRUE
The claim concerns the distribution of MUDRA loan accounts: it states that 76% belonged to women and more than half to people from SC, ST and OBC communities. The review checked this by consulting year-wise performance reports on the PMMY website and combining figures for 2015–16 through 2017–18. It reports 12.27 crore accounts overall, of which 9.03 crore belonged to women entrepreneurs and 6.71 crore to SCs, STs and OBCs. Those figures imply women held about 73.6% of the accounts (reported by the review as around 74%), while the SC/ST/OBC share was about 54.7% (reported as around 55%). Thus the review’s evidence supports the claim’s main point that these communities accounted for more than half of the accounts, but its reported women’s share is lower than the stated 76%. The review nevertheless concludes that the claim is accurate. The supplied text does not explain the difference between 76% and its approximately 74% calculation, so it does not establish that the two figures are identical.

Cargo traffic at major ports was 570.32 million tonnes in 2010-11 and it has increased to 679.367 million tonnes in 2017-18
Publisher’s rating: TRUE
The claim concerns cargo handled at India’s major ports: it gives 570.32 million tonnes for 2010–11 and 679.367 million tonnes for 2017–18. The review says it compiled figures from answers to parliamentary questions, the Open Government Data Platform, and publications from the Ministry of Shipping and Ministry of Statistics & Programme Implementation. It reports that its figures for those two years were 570.09 million tonnes and 679.36 million tonnes, respectively—close to, but not identical with, the figures stated in the claim. The review’s comparison shows an overall increase: it gives 555.49 million tonnes for 2013–14 and 679.37 million tonnes for 2017–18, describing that as a 22% increase during the current government. It also says cargo handled had generally risen since 2001–02, with a dip during 2011–14. Thus, the review’s figures support the claim’s broad direction and approximate scale, while its stated 2010–11 value differs from the claim by 0.23 million tonnes. The article nevertheless labels the claim TRUE.


Forex reserves booming at 418.94 billion USD.
Publisher’s rating: TRUE
The claim appeared in an infographic on the government’s 48-months portal in May 2018. The review says the infographic described India’s foreign-exchange reserves as “booming” at $418.94 billion. It notes an important limitation: the claim did not specify the date on which reserves supposedly stood at that amount, so the reviewer could not match the quoted figure to a particular date.
FDI jumped to $60.08 billion in 2016-17.
Publisher’s rating: TRUE
The claim concerns gross FDI in India in the 2016–17 financial year. The review says the infographic’s figure was correct and identifies the Reserve Bank of India’s annual “Foreign Investment Flows” data as its source. It reports that the figure for that year was $60.08 billion. The review qualifies the impression that this was a new or exceptional jump: it says gross FDI had been on an upward trend since 2005–06, with minor differences. It also distinguishes gross inflows from net FDI, which accounts for money repatriated or disinvested after entering the country. The review says these two measures began to diverge from 2008–09 as repatriation and disinvestment increased. That distinction matters to the broader picture, but it does not alter the review’s finding about the quoted gross-FDI figure. The review reports that net FDI fell in both 2016–17 and 2017–18, and gives a decline from $44.907 billion in 2015–16 to $39.431 billion in 2017–18. Thus, the infographic’s number is supported as a gross inflow figure, while it should not be taken on its own as evidence that net FDI was also rising.

央行表示:真鈔是先印「條狀光影變化箔膜」然後才印凹版印刷的字印上去,因此這圓字是要在上面的才是真鈔。
Publisher’s rating: 大部分屬實

「為何日客來台變少?野島剛:因為日本按摩比台灣便宜」?
Publisher’s rating: 錯誤
The review examined a media headline claiming that Japanese visitors to Taiwan were decreasing because massage had become cheaper in Japan. It distinguished the number of Japanese tourists visiting Taiwan from the number of Japanese visitors who came to Taiwan for massage. The review reports that Nojima said his column concerned the latter, not a decline in Japanese tourism overall: he described fewer Japanese people getting massages in Taiwan, and said the media had quoted him incorrectly. To assess the tourism trend, the review cited Tourism Bureau statistics. It says annual Japanese visitor numbers rose from 1,000,661 in 2009 to 1,898,854 in 2017, an increase of about 89.7 percent. It also reports 1,769,053 Japanese visitors for January through November 2018. These figures contradict the headline’s broad claim that Japanese arrivals were declining. The review also compared the headline’s wording with the column and sought clarification from Nojima. The column referred to fewer Japanese tourists coming to Taiwan to enjoy massage and linked that change to Japan’s “price collapse”; Nojima confirmed that he meant massage activity, not the total number of Japanese tourists visiting Taiwan. The review therefore found that the headline conflated a change in one activity with a decline in overall arrivals.

Jio owner Mukesh Ambani is providing free T-shirts on the occasion of New Year to 1 lakh Jio customers.
Publisher’s rating: FALSE

Nunca antes hubo tantas afiliadas a la Seguridad Social, casi 9 millones, y nunca antes alcanzamos el 46,4% del total
Publisher’s rating: Engañoso

There has been a 50% increase in track renewal in 2017-18 compared to 2013-14. In 2013-14, it was 2,926 kms and in 2017-18 it is 4,405 kms.
Publisher’s rating: TRUE
The claim concerns the length of railway track renewed in India in 2013–14 and 2017–18. The review checked the cited figures against track-renewal data it collated from Ministry of Railways annual reports, the government’s open-data portal, answers in both houses of Parliament, and a government press release. Its findings do not exactly reproduce the claim’s figures: the review reports 2,885 kilometres renewed in 2013–14, rather than 2,926, and says the 2017–18 total was more than 4,000 kilometres, rather than giving 4,405 as its confirmed figure. The review’s main discussion says the 2017–18 figure was “more than 4400 kms,” while its concluding fact-check says “more than 4000 kms.” It therefore supports a substantial increase over the review’s 2013–14 figure, but the excerpt does not provide a single precise 2017–18 total that independently verifies the claim’s exact 4,405-kilometre figure. Comparing the review’s reported 2,885 kilometres with a 2017–18 total above 4,400 implies an increase exceeding roughly 52%, consistent with the claim’s approximate 50% characterization. The review also supplies context that complicates a comparison focused only on those two years: its reported annual average was 3,357 kilometres during UPA-2, compared with 3,027 kilometres during the first four years of the subsequent government. Thus, the particular year-to-year increase does not by itself show that renewal was higher on average across the later period. The excerpt also describes renewal as planned according to track condition and available funds, rather than as a simple year-by-year target.

2019 ஜனவரி 1-ம் தேதி முதல் சுங்கச்சாவடியில் கட்டணம் செலுத்த தேவையில்லை.
Publisher’s rating: Fake

Loans up to Rs. 9 lakh and Rs. 12 lakh get interest subvention of 4% and 3%.
Publisher’s rating: TRUE

España lidera el crecimiento del PIB de las principales potencias europeas, con el 0,6%
Publisher’s rating: Verdadero
Newtral’s review directly addresses Pedro Sánchez’s statement that Spain led GDP growth among the major European powers, with growth of 0.6%. The excerpt reports that Newtral judged this statement true and points readers to Eurostat data as the basis for checking it. The supplied excerpt does not include the Eurostat figures, the period being compared, or details of Newtral’s calculation. It therefore supports the finding that Newtral checked and endorsed the specific statement, but does not provide enough underlying data to independently assess how the 0.6% figure or comparison with other major European economies was derived.